
Every company has a simple goal: to work smarter, not harder. But achieving that goal isn’t always a walk in the park. It means keeping a close eye on how well different teams and individuals are doing, and that can be a real hassle. This is where Key Performance Indicators, or KPIs, come to the rescue. Think of them as handy little tools that help you keep tabs on how things are going and compare your performance to your own standards. And if you want a user-friendly way to do all this, you’ve got Workday Dashboards. They’re like the trusty sidekick that makes managing and tracking your KPIs a breeze.
Understanding Workday Dashboards:
Workday Dashboards are flexible and dynamic tools that give users a thorough overview of important business data as well as real-time insights. Because these dashboards are customizable, users may add, rearrange, and resize different widgets, such scorecards, charts, and reports, to suit their own requirements. They are interactive, enabling visitors to examine specific information, apply filters, and drill deep into data. Workday Dashboards are designed with security and mobile accessibility in mind, allowing users to access the most recent information while on the road. They also guarantee that users may only access data that has been authorized. Organizations may streamline decision-making processes by using Workday Dashboards, which provide a centralized, user-friendly solution for tracking key performance metrics and making data-driven choices.
Use-Cases for Workday dashboards:
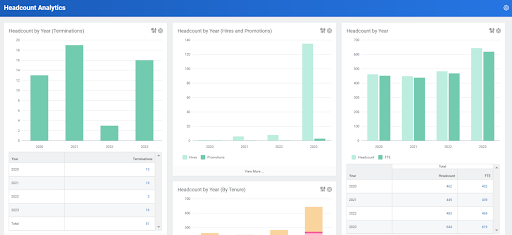
- HR Analytics and Reporting: Workday Dashboards allow HR professionals to keep an eye on important HR indicators including employee attrition, hiring status, and performance reviews. Dashboards enable HR teams to make data-driven choices by giving them a real-time snapshot of workforce-related data.
- Financial Performance Monitoring: To monitor financial KPIs including revenue, spending, and budget variations, finance teams might build dashboards. This enables them to closely monitor the organization’s financial health and modify their strategy as necessary.
- Manager Self-Service: Managers may examine team performance, authorize time-off requests, and track project progress by customizing Workday Dashboards to provide them real-time insights into their team’s performance.
- Employee Self-Service: Workers have access to dashboards where they may handle duties like time-off requests and performance targets in addition to reviewing their personal information, pay stubs, and perks. Transparency is increased and administrative load is decreased with this self-service option.
- Recruitment and Talent Management: To keep track of job opportunities, applicant pipelines, and recruitment metrics, HR and recruiting teams can build dashboards. This enhances applicant experiences and expedites the recruiting process.
- Compliance and Regulatory Reporting: Executives and compliance officers may be given a fast overview of the organization’s compliance with regulations and any possible problems that require attention through dashboard configuration.
- Workforce Planning: Dashboards may be used by organizations to evaluate the skill shortages, succession planning, and workforce demographics. Talent development and long-term strategy planning can both benefit from this knowledge.
- Benefits Administration: To monitor and share information on employee benefits including health insurance, retirement plans, and wellness initiatives, HR and benefits teams can make use of dashboards.
- Project Management: To assist in making sure that projects stay on schedule and under budget, project managers may customize dashboards to check project progress, budgets, and timeframes.
- Supplier and Vendor Performance: By tracking delivery schedules, prices, and quality, organizations can keep an eye on the performance of suppliers and vendors, which may aid in vendor management and procurement choices.
Workday Dashboards offer an organized and adaptable data perspective, which makes them an important instrument for boosting productivity, facilitating better decision-making, and encouraging openness throughout the whole company. The use-cases could change depending on the requirements of an organization and the functional domains in which Workday is deployed.
How do Workday Dashboards work:
Below is a process on How to configure Dashboards in Workday, populate data using reports as Worklets and secure the data using Workday’s Security Model.
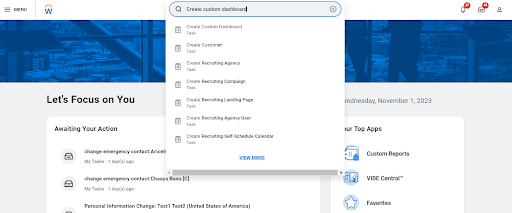
1. Creating Workday Dashboards: Users can create new custom workday Dashboard from scratch or use pre-built templates provided by Workday or their organization. When creating a dashboard, users define the structure, layout, worklets and domain security they want to include.
Note: User can Enter ‘Create Custom Dashboard Task’ in the Search box to create a dashboard.
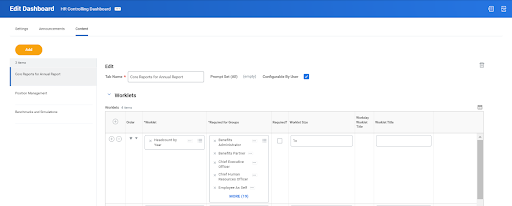
2. Importing Data from Worklets: Workday Dashboard can be populated with data from various report worklets. These report worklets, which are shortcuts that give you instant access to a report. The worklet can be added to your dashboard.
Note: Report can be used as Worklet by enable as worklet option in output section of report.
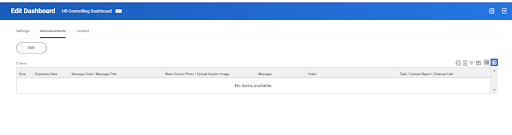
3. Setting up Announcements: Announcements in Workday Dashboards are enhanced by rules, which enable targeted, automated, and consistent communication. Using rules ensures messages reach the right audience, are personalized, and comply with regulations, all while streamlining the process.
4. Collaboration: Workday dashboards support collaboration among users. Multiple users can work on the same dashboards simultaneously, making real-time updates and changes.
Key Benefits of Workday Dashboards:
Workday Dashboards provide several significant advantages to businesses in several areas, such as finance, human resources, and general decision-making. The following are the main advantages of using Workday Dashboards:
- Real-Time Data Access: Workday Dashboards offer real-time data access that is current and up to date. This guarantees that decision-makers have access to the most recent data, allowing them to act quickly and intelligently.
- Customization: Users can modify their dashboards to suit their own requirements. By allowing for customization, people may increase efficiency and relevance by concentrating on the data and KPIs that are most important to them.
- Visual Data Presentation: Dashboards make complicated information simpler to understand by presenting data visually using tables, charts, and graphs. Data visualizations can aid in the rapid identification of trends, anomalies, and relationships.
- Interactivity: Users may dive down into data, apply filters, and examine specifics thanks to dashboards’ interactive features. Investigating certain data points and gaining deeper insights are encouraged by this interaction.
- Effective Decision-Making: When pertinent data is easily accessible, decision-makers can make better decisions that result in better results and a more flexible reaction to opportunities and challenges.
- Mobile Accessibility: Workday Dashboards are made with mobile devices in mind, with flexible design and easy navigation. Users may access vital information on the go because to this flexibility, which improves decision-making and productivity.
- Security: The security responsibilities and permissions of the organization are respected by Workday Dashboards. This protects the privacy and integrity of data by guaranteeing that users only view information that they are permitted to view.
- Collaboration: By sharing their personalized dashboards with colleagues, users may foster cooperative decision-making and the exchange of insightful information. This encourages cooperation and group problem-solving.
- Productivity and Efficiency: Dashboards facilitate data availability and cut down on the time and labor needed to collect and examine data. Throughout the company, productivity rises because of this efficiency.
- Alignment with Objectives: Dashboards let businesses monitor important performance metrics and make sure that their actions are in line with their strategic goals. They support tracking objective progress and making necessary strategy adjustments.
- Cost Reduction: Workday Dashboards may assist organizations in lowering expenses associated with data analysis and reporting by centralizing data and minimizing the requirement for external tools.
- Data Integrity: Workday Dashboards improve data accuracy and integrity by using data that comes from a centralized source. This lowers the possibility of mistakes and inconsistent data.
- Better Manager and Employee Self-Service: Workday Dashboards provide managers and workers the ability to view and control their own data, which relieves administrative and HR staff of some of their administrative responsibilities.
- Regulatory Compliance: Dashboards may be set up to assist companies in monitoring adherence to pertinent laws and guidelines, lowering the risk associated with noncompliance.
In conclusion, Workday Dashboards, with its real-time data access, customization options, and interactive features that boost efficiency and productivity, provide businesses with a strong tool to help them make better decisions, obtain actionable insights, and streamline their operations.
Best Practices for Utilizing Workday Dashboards:
It’s crucial to adhere to best practices to maximize the potential of Workday Dashboards and guarantee their efficacy. The following are some essential rules for making efficient use of Workday Dashboards:
- Establish Clear Goals: To begin, decide what your dashboards’ goals should be. Recognize your objectives and the measurements and data that are most pertinent to achieving them.
- Customize for User Roles: Make dashboards based on user roles that are suited to the requirements of various user groups in your company. Different data perspectives may be needed by financial teams, managers, executives, and HR specialists.
- Pay Attention to Important Metrics: Steer clear of packing dashboards with too much information. Focus on presenting key performance indicators (KPIs) that are closely associated with your objectives and requirements for making decisions.
- Visual Clarity: To show data in an understandable and plain manner, use the right visual aids, such as scorecards, graphs, and charts. Make sure it is simple to understand the visual representations.
- Real-Time Updates: Make the most of the real-time data features available. Configure dashboards to update automatically, giving decision-makers access to up-to-date data.
- Data Consistency: Make sure that all the organization’s data is high-quality and consistent. Inconsistent or inaccurate data might result in bad decisions. To preserve data integrity, collaborate with data owners.
- Interactive Features: Make the most of interaction by giving consumers the ability to examine data, apply filters, and drill down into specifics. This gives consumers the ability to look at certain data points.
- Mobile Optimization: Create dashboards that are mobile-friendly so that customers can access vital data on tablets and smartphones. To make sure the mobile experience is usable, test it.
- Security Considerations: Make sure users are only accessing data that they are authorized to see by carefully managing security settings. Use role-based security to safeguard confidential data.
- Regular Maintenance: Check and update dashboards on a regular basis to make sure they still meet the evolving demands of your company. Subtract any superfluous or out-of-date items.
- Training and assistance: To guarantee that users are aware of how to utilize dashboards efficiently, offer training and assistance. This include drafting documentation and providing support as required.
- Feedback and Iteration: Welcome input from users and be willing to make changes in response to their recommendations. Iteration over time aids in improving dashboard usability.
- Integration of Data Sources: To present an all-encompassing picture, combine data from several sources, including external systems. Setting up connections or APIs to access external data may be necessary for this.
- Data Governance: To ensure data correctness, consistency, and quality, establish data governance procedures. Make that the data is correctly cleansed, verified, and recorded.
- Data Privacy and Compliance: When working with sensitive data in dashboards, follow data privacy laws and compliance specifications. Establish appropriate audit trails and access controls.
- Performance Monitoring: Pay close attention to dashboard performance, especially when working with big information. To get the best load times, optimize your queries and data retrieval.
Workday Dashboards are flexible parts that you may incorporate into your home page. Pre-configured dashboards for functional areas are available in Workday. You have the freedom to design an infinite number of unique dashboards in addition to using these pre-configured Workday dashboards. A group of worklet-configured custom reports can be displayed on each custom dashboard. Workday has an infinite number of dashboard kinds, each of which may include up to six worklets. With the Maintain Dashboards task, you may control which dashboards are available for user setup.