
Workday dashboards can put the reports, tasks, and measures a team uses in one place. That convenience helps when each dashboard supports a defined audience and decision. A page filled with charts may look complete while leaving managers unsure which result needs attention or who should act.
A useful dashboard starts with the operating question, not the available chart types. Teams need agreed KPI definitions, trusted report logic, suitable security, and an owner who will maintain the content after launch. This guide covers the design and governance choices behind Workday dashboards that people can use with confidence.
Define the job of each Workday dashboard
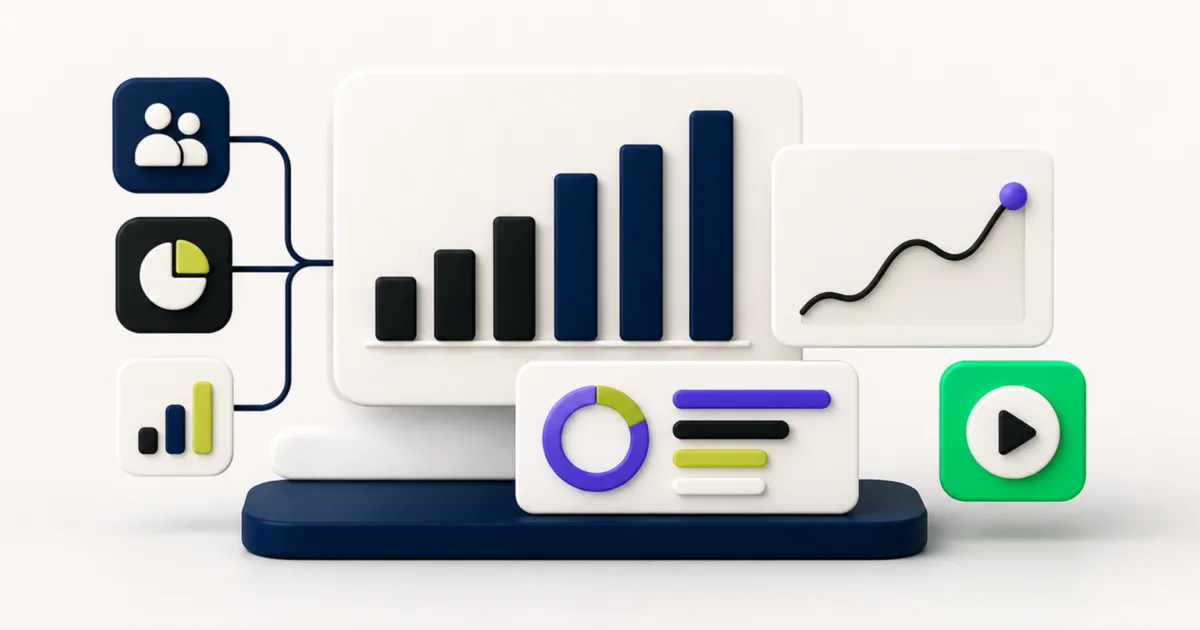
Name the audience and the decision before selecting reports. An executive workforce dashboard may track trends and exceptions across the company. A manager dashboard may need current team measures, pending tasks, and direct links to supporting detail. Combining both purposes can produce a crowded page that serves neither group.
Write a short dashboard brief that answers these questions:
- Who uses the dashboard?
- Which decisions or actions should it support?
- How often will the audience review it?
- Which population and time period belong in scope?
- Which exceptions need attention?
- Who owns the dashboard and each underlying report?
Use the brief to decide what belongs on the first view. Supporting detail can sit in a maximized report, a separate tab, or a linked report.
Choose KPIs people can interpret
A KPI needs a name, formula, population, time basis, source, owner, and threshold. “Turnover” can mean voluntary turnover, total turnover, or regrettable attrition. Two leaders may reach different conclusions if the dashboard does not state which definition applies.
Connect each measure to an action
Ask what a user should do when a measure changes. A recruiting dashboard might show open requisitions, time in stage, offer acceptance, and aging positions because each result supports a staffing decision. A measure that has no owner or response path adds noise.
Separate status, trend, and detail
Use a summary measure to show current status, a trend to show direction, and a detailed report to help users investigate. One visual should not carry all three jobs. Keep labels, periods, units, and comparison points consistent so users can read the page without reconstructing its logic.
Document the calculation
Store the definition near the report documentation or data catalog. Include exclusions, effective-date rules, calculated fields, and known limitations. If teams need help controlling custom logic, the EVOCS Workday calculated fields guide provides a governance framework.
Build the dashboard from governed reports and worklets
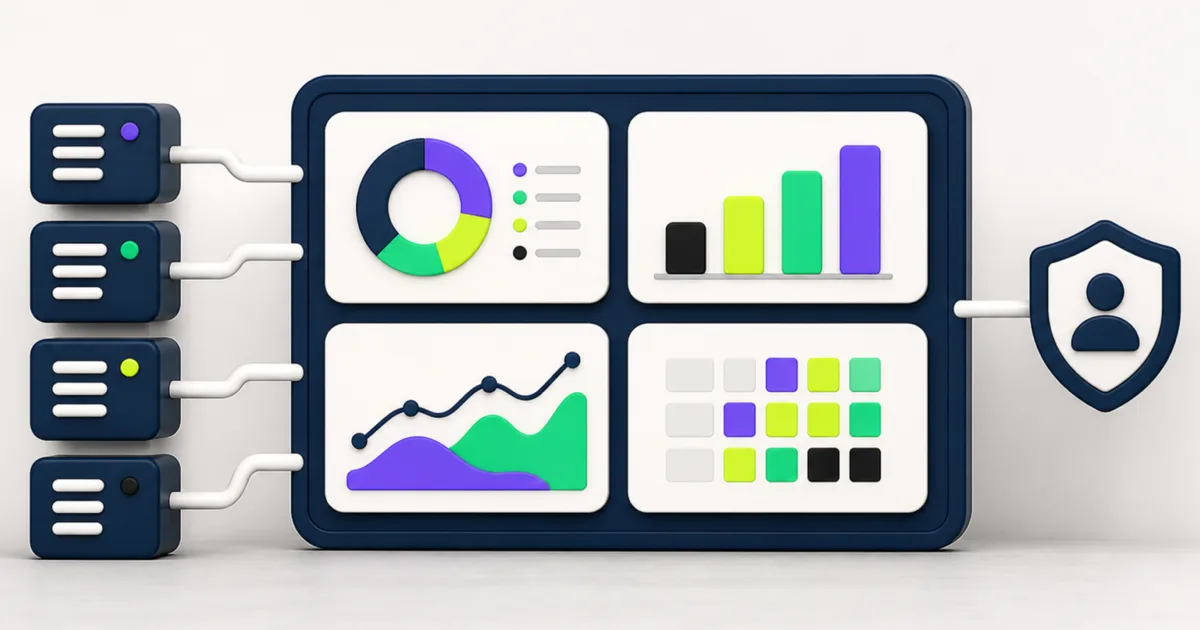
Workday dashboards organize related content for a target audience. Workday’s Worklets and Dashboards guidance explains that teams can enable eligible custom reports as worklets, then place them on delivered or custom dashboards. Menus and announcements can also give users access to tasks, links, and time-sensitive information.
Prepare each report for dashboard use
Start with a report that answers one part of the dashboard brief. Confirm the data source, prompts, filters, sorting, sharing, and output before enabling it as a worklet. Show the few fields that users need in the compact view and give them a path to the full report for investigation.
Workday supports several report types as worklets, including advanced, matrix, nBox, transposed, trending, and composite reports. Search and simple reports do not support worklet use according to the current Workday training documentation. Available options still depend on your tenant, products, and security.
Use tabs and prompt sets with restraint
Tabs can separate related views without creating separate dashboards. Keep each tab tied to one audience question. A workforce dashboard might separate composition, movement, and talent, but each tab should use consistent definitions and periods.
A dashboard prompt set can pass shared values, such as a supervisory organization or date, across the worklets on a tab. Workday’s dashboard content instructions explain that a prompt-set tab uses required worklets and cannot remain user-configurable. Test every prompt mapping and default because one mismatch can make adjacent measures appear inconsistent.
Design for scanability and action
Put the highest-value measures first. Use short worklet titles that match the audience’s language. Keep visual treatments consistent across related metrics, and reserve strong color for a defined exception or state. Decoration should not compete with the data.
Give users a clear route from summary to detail:
- Place a small set of decision measures on the first view.
- Sort and filter worklets so the most useful rows appear first.
- Hide nonessential columns from the compact worklet view.
- Configure the maximized report for investigation.
- Link tasks or guidance when the user needs to act.
- Explain thresholds and status colors in plain language.
Test on the devices your audience uses. A dense desktop arrangement can become hard to read on a smaller screen. Mobile access may suit a short status view, while detailed analysis may require the full report.
Protect data through layered security
Dashboard access and report access solve different parts of the security problem. Workday secures dashboards to domains, while each custom report also has data-source, field, and sharing controls. A user may reach a dashboard yet lack access to one of its worklets or underlying fields.
Test security with realistic roles and organizations. Include managers, HR partners, finance users, executives, delegated users, and transferred workers where they belong in scope. Confirm who can view the dashboard, run each report, change prompts, maximize a worklet, export results, and edit the underlying definition.
Do not use an administrator’s successful test as proof that the audience can use the dashboard. Administrators often have access that hides missing domain permissions, report sharing, or organization assignments.
Keep dashboard performance under control
Each worklet retrieves report data when the dashboard loads. A page with many broad reports, weak filters, deep related-object paths, or complex calculated fields can delay the entire experience. Workday advises teams to limit worklets on a tab and design each report for fast loading.
Measure load time with representative users and data volumes. Then review the slow worklets one at a time. Narrow the population, set useful prompt defaults, reduce returned rows, simplify calculations, or replace a detailed worklet with a summary and a link to the full report. Removing visual clutter will not correct slow report logic.
Test the complete decision path
A dashboard test should cover the numbers, the access model, and the user’s next action. Build test cases from known records and business scenarios rather than checking whether every worklet renders.
- Reconcile each KPI with an approved source or delivered report.
- Trace selected results to their underlying workers, transactions, or events.
- Check current, prior-period, future-dated, corrected, and rescinded records where relevant.
- Test prompt defaults and shared prompt values across a tab.
- Confirm status colors and thresholds against the documented definition.
- Test links, maximized views, exports, menus, and tasks.
- Repeat the test under each audience security role.
- Record the owner and resolution for each defect.
Ask several intended users to complete a real task with the dashboard. Watch where they hesitate, which fields they ignore, and whether they can explain the result. Those observations often identify issues that a technical test script misses.
Establish ownership after launch
Workday dashboards need maintenance as organizations, security assignments, report logic, and business priorities change. Assign a business owner for the decisions and definitions, plus a technical owner for configuration and support.
Review usage, performance, access, KPI definitions, and stale content on a set schedule. Workday’s Maintain Dashboards tools support centralized administration of delivered and custom dashboards. Before removing a worklet or report, check where teams use it and confirm the change with its owner.
Include dashboard changes in release and regression planning. A change to a data source, calculated field, security policy, or business process may affect several worklets at once. EVOCS managed services can support reporting governance, release review, optimization, and administrator enablement.
Common Workday dashboard problems
Adjacent KPIs disagree
Compare the population, source, effective date, prompts, filters, and security context for both reports. Similar labels do not guarantee shared definitions.
A worklet is blank for some users
Check dashboard-domain access, report sharing, data-source security, field security, organization access, and required prompt defaults. Test as the affected user or a representative proxy.
The dashboard takes too long to load
Measure each worklet, then reduce the reports that return broad populations or complex calculations. Limit the first view to the measures users need for the immediate decision.
Users export the data instead of using the dashboard
Ask which task they complete after export. They may need a different sort order, extra detail in the maximized report, a reusable prompt, or a workflow outside the dashboard.
Questions teams ask about Workday dashboards
What are Workday dashboards?
Workday dashboards organize reports enabled as worklets, menus, links, tasks, and announcements for a defined audience. Teams can configure delivered dashboards and create custom dashboards, subject to tenant features and security.
How should a team choose dashboard KPIs?
Choose measures tied to a decision, owner, and response. Document the formula, population, time period, source, exclusions, and threshold before building the visual.
Why can two users see different results?
Workday applies the viewer’s security to dashboards and their underlying reports. Organization assignments, domain permissions, report sharing, field access, and prompt values can produce different results.
How many worklets should a dashboard contain?
Use the smallest set that supports the audience’s decisions. Workday warns that adding more worklets can increase load time. Split unrelated questions across focused tabs or separate dashboards instead of filling the page.
Turn dashboard data into an operating routine
Teams trust Workday dashboards when the measures stay consistent, the security matches their role, and each result leads to a clear action. Good report logic and page design establish the starting point. Ownership, testing, and review keep the dashboard useful as the business changes.
EVOCS helps organizations design, test, and govern Workday reporting and dashboards across HR, finance, and operations. If teams question the numbers or struggle to maintain a growing dashboard catalog, schedule a strategy conversation. We can help identify the source of the problem and define a practical improvement plan.